Everyone knows sometimes a picture is worth a thousand words; adding tables, charts and graphs to your document can help readers visualize and digest the information contained, and add some "visual interest"in the bargain.
Inserting a Table
Tables may be easily added to a text document.
- Place cursor in document where you want to insert the table.
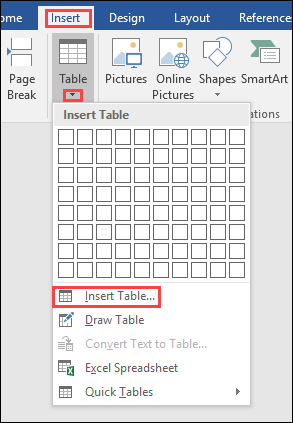
- Click the Insert tab
- In the Tables group, select dropdown menu.
- Select Insert Table from the resulting menu.
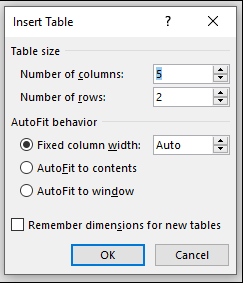
- In the Table Size section, enter the number of columns and rows.
- Optional: Select options in the AutoFit behavior
- Click OK
Note: To quickly insert a table, click the Table button in the Tables group and drag to select the number of rows and columns. Click in last selected cell of grid to insert Table.
Converting Text to Table
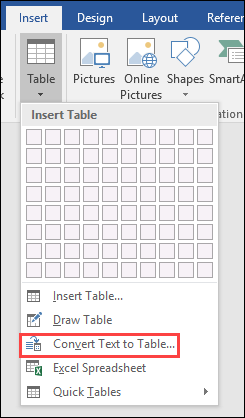
Sometimes text in a document may be better illustrated as a table. To convert existing text to a table:
- Highlight text to be converted to a Table
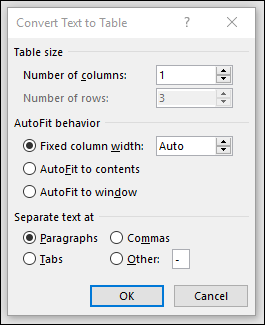
- Click the Insert tab >Table> Convert Text to Table> dialog box opens
- Complete fields for options: Table Size, Auto fit and Separation character
- Click OK
Inserting a Picture, Clip Art, Shape, SmartArt, or Screenshot
Pictures and graphics add punch to your document, but remember not to overdo them! They are there to enhance your information, not eclipse it!
- Place cursor in the document where you want to insert the item
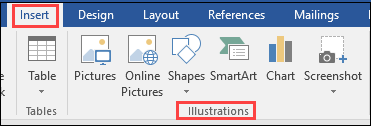
- On the Insert tab, in the Illustrations group, do one of the following:
- To insert a Picture from a file: select Picture. Locate and select the file you want to insert from your computer and click the Insert
- To insert an Online Picture: select Online Pictures. In the task pane, enter a keyword in the Search box and click the magnifying glass icon. Select desired image and click
- To insert a Shape: click the Shapes dropdown menu. Select the Shape you want from the resulting menu. Click and drag in the document to create the Shape.
- To insert a SmartArt Graphic: select SmartArt. Select the desired SmartArt graphic from the menu. Click OK.
- To insert a Screenshot: select Screenshot button. To insert a screen that you have open on your computer, select the screen from the Available Windows. To create your own screenshot, select Screen Clipping. Click and drag the area of your screen you want to insert.
Optional: Format the graphic or shape using the Table Tools contextual tab that appears on the Ribbon when the image is selected

Inserting a Chart or Graph
- On the Insert tab, in the Illustrations group, click Chart.
- Select the type of chart desired and click OK.
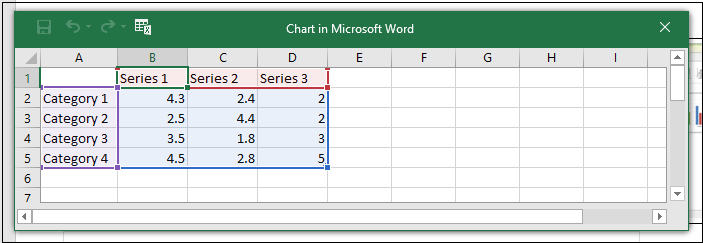
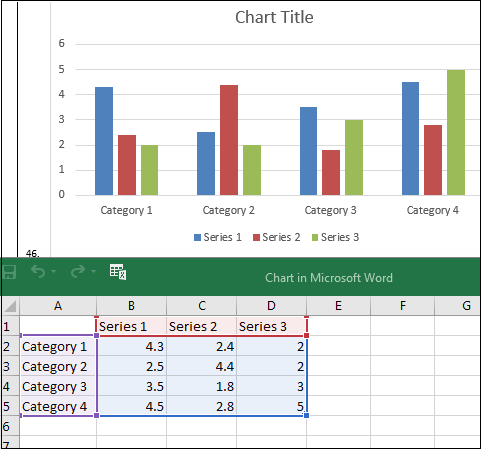
- Edit the data in the Excel sheet that opens with the Chart. When you are finished editing the data, close the data sheet.

Changing data in an existing chart
- Select the Chart in your document
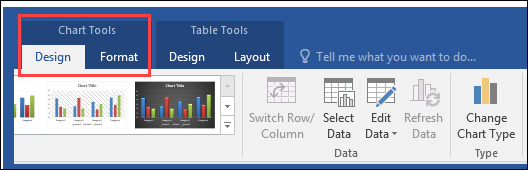
- In the Chart Tools contextual tab in the Ribbon, select Design tab>Edit Data
- A data spreadsheet will open; make desired changes
Creating Columns
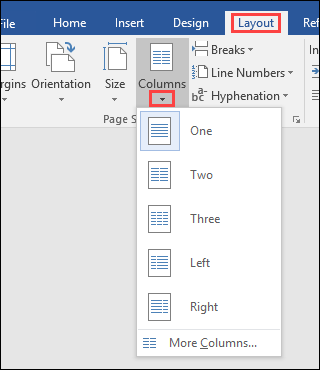
- Select desired text and under the Layout tab, Page Setup group, click the dropdown for Columns, then select number of Columns desired
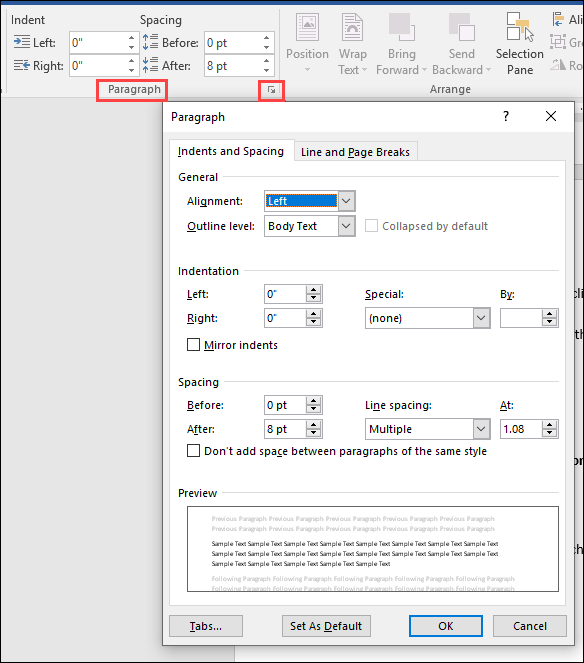
- Use Paragraph group to set options for Column spacing, location, etc. Expand Group for more options.