Excel easily converts your data to charts and graphs right within the application. These items can be placed in PowerPoint presentations or Word documents with automatic updating!
Creating a Chart
- Select the data that is to be represented by the Chart (usually in a Table)
- Select the cell(s) you want by clicking and dragging the cursor until all data is included in highlighted area
- Totals are not typically included in a Chart
- Navigate to the Insert tab on the Ribbon
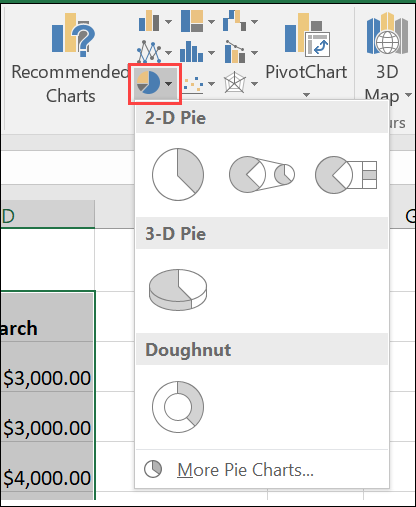
- In the Charts group, select the type of Chart you wish to create (click Recommended Charts to see what Excel recommends for the type of data selected)
- Most popular Charts are Column, Pie and Bar
- A brief description of each Chart type can be seen by hovering your cursor over the specific Chart type icon
- Click the dropdown for the desired Chart type to view all options
- Click desired option to insert selected Chart into Worksheet
Formatting a Chart
Moving & Resizing
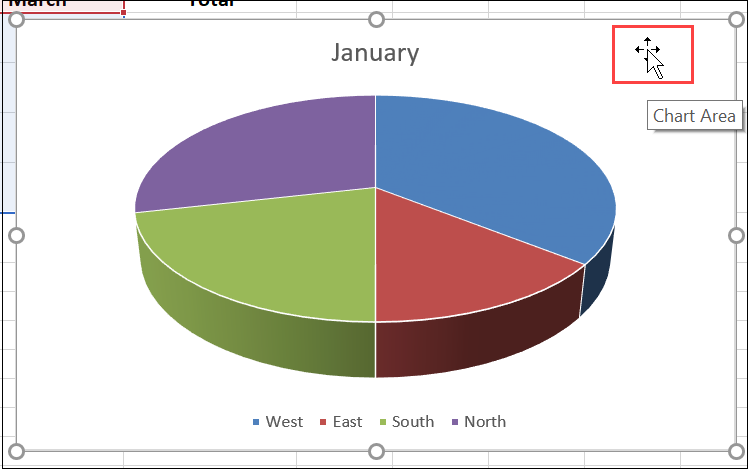
- Select Chart by clicking anywhere on it- edges will appear
- Resize by placing cursor on any corner or center marker and dragging to desired size
- Move a Chart by clicking anywhere on chart; when cross arrows appear, drag to new location.
*NOTE: Formatting a Chart can be accomplished by using the Chart Tools contextual tab on the Ribbon, which appears anytime the Chart is selected in the Worksheet
Chart Title
- Insert a Chart Title by selecting the chart area and selecting the Chart Elements tool icon at the right of the Chart (green plus sign)
- Select check box next to Chart Title- Title box will appear on Chart
- Click in box to change Title as desired
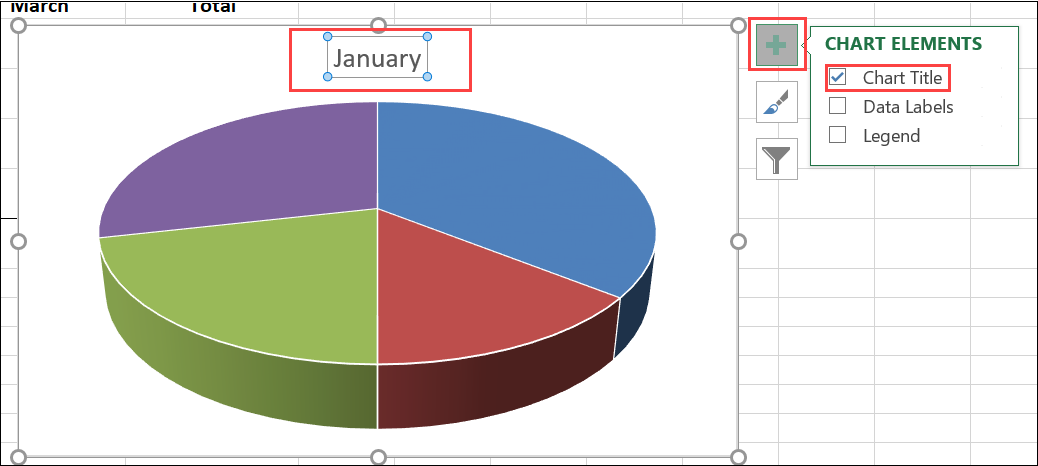
Chart Legend
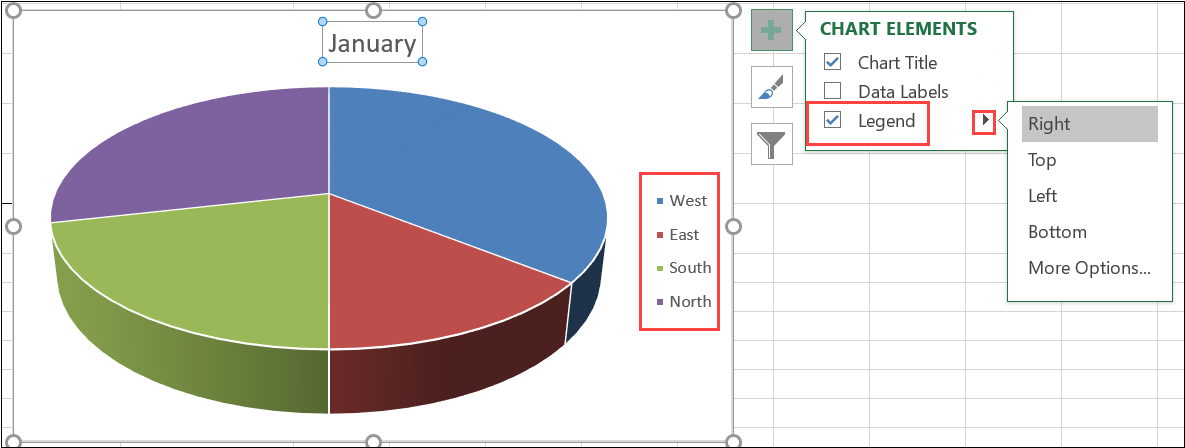
A Chart Legend is a means of identifying the data in the Chart. Insert a Chart Legend by following the steps outlined above and selecting the Legend checkbox in the Chart Elements tool.
Sparklines
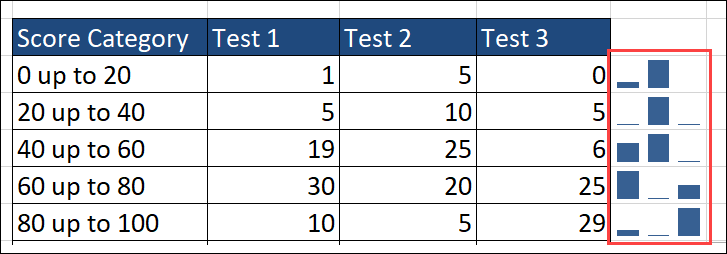
A Sparkline shows the general shape of variation in one cell next to the data included for the Sparkline; it's a "mini-chart".
- Select the data to be represented by the Sparkline.
- Navigate to the Insert tab on the Ribbon
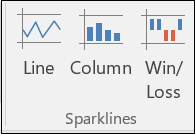
- In the Sparklines group, select the desired type of Sparkline
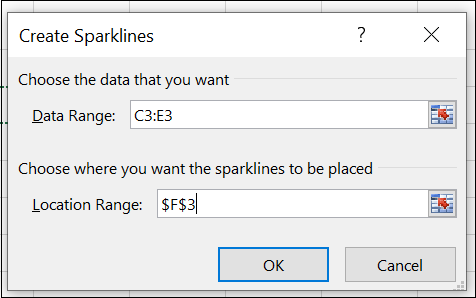
- A dialog box will open to select a location for your Sparkline
- Enter cell location (or click on cell(s)) where Sparkline is to be inserted
- Click OK
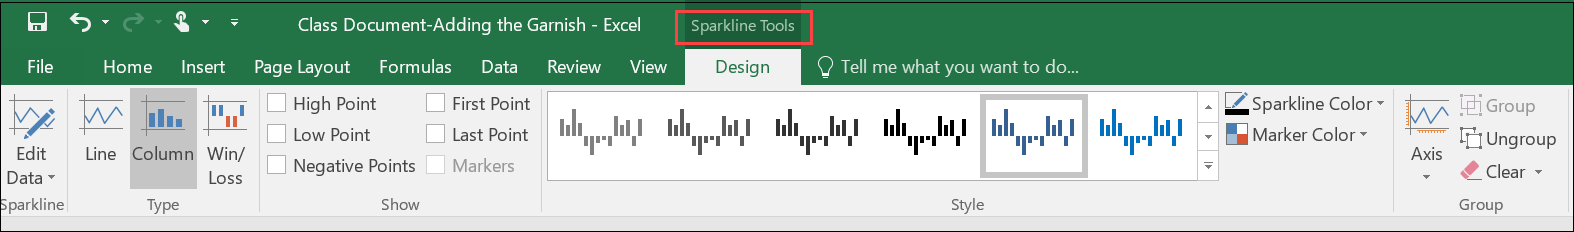
*NOTE: To format the Sparklines, use the Sparkline Tools contextual tab on the Ribbon
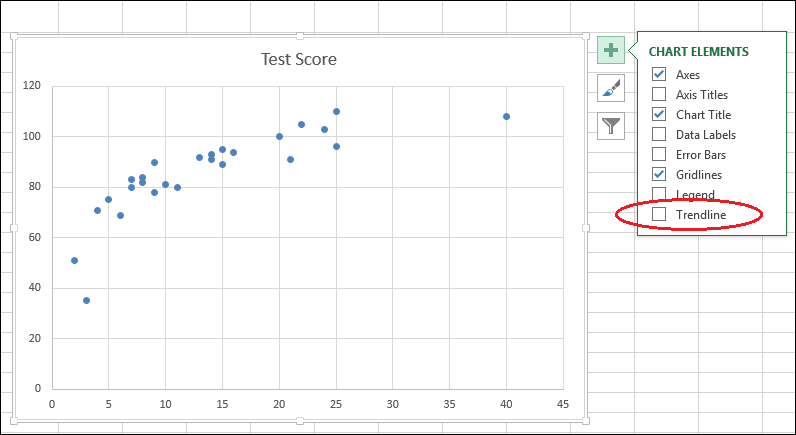
Trendline
Trendlines illustrate data trends and enable predictions; a Trendline is particularly helpful with a Scatter Chart
- Access the Chart Elements tool; select checkbox next to Trendline
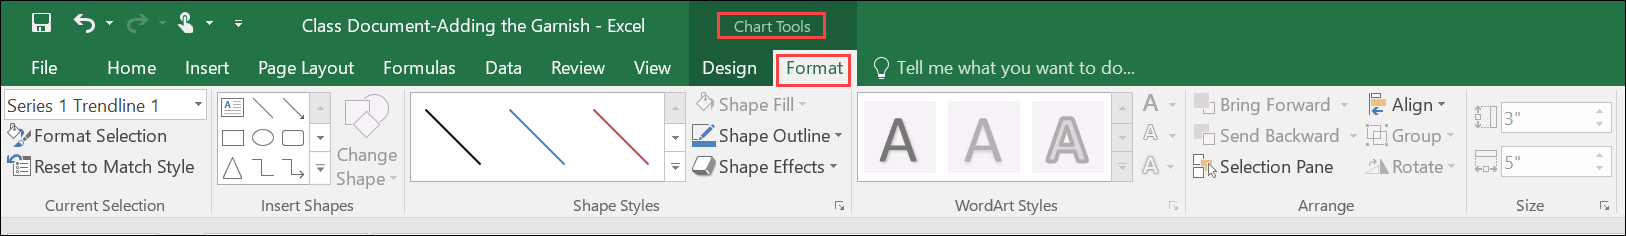
- To format the Trendline, go to Chart Tools contextual tab on Ribbon and select dropdown for Shape Outline and Shape Effects
Printing a Chart or Graph
To print your Chart or Graph from your Excel Worksheet without printing additional data:
- Select the Chart on your Worksheet; go to the File tab and select Print.
- Select desired Settings and click Print
*NOTE: Failing to select the Chart or Graph prior to printing will print the entire Worksheet.